
Traders signal offers in the Standard & Poor’s 500 stock index options pit ahead of the much-anticipated statement from the Federal Reserve (Getty)
What was that you just heard in the background on Bloomberg or CNBC? Something about Goldilocks? The reference of a children’s classic has gone from cute, innovative nomenclature by talking heads to as much a standard of the investing lexicon as “stock-picker’s market” or “the trend is your friend.”
Here’s a breakdown of how to read a Goldilocks Economy and what it could mean for shares you hold.

The iconic image of a tired Goldilocks. (Getty)
What Defines a Goldilocks Economy
The analogy at its very simplest is that, just like the third bowl of porridge and third bed at the three bears’ house, the Goldilocks Economy is not too hot and not too cold — it’s just right.
“Just right” is naturally very subjective for investors, companies and investors. But for stocks market purposes that standard meaning is that the U.S. (or any other) economy is growing at a solid rate, but it’s not growing at such a clip as to push inflation significantly higher.
The stock market, overall, tends to fall with higher interest rates and rise when rates are lower. This happens for a number of reasons, including that fact that companies have to pay more to borrow when rates are higher and that bonds become more attractive to investors than stocks as fixed-income yields rise compared to equities in a higher-rate environment.
But is there ever an entire Goldilocks Economy? It’s debatable that such a condition could last for a long enough time period to call an entire economy not too hot or cold.
Some argue the idea of an entire Goldilocks Economy is a myth.
For individual investors it is more important to focus on separate Goldilocks Numbers (economic indicators) to identify a trend and make portfolio decisions based on that homework.
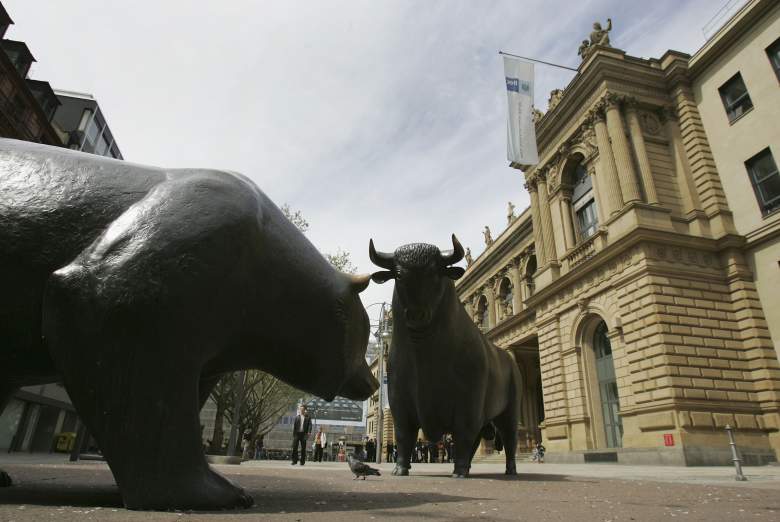
The bull and bear statues outside of the Frankfurt Stock Exchange (Getty)
Numbers to Watch for Bears and Bulls
Throughout the month there are a regular number of economic indicators released by the government and other institutions that have market-moving potential. You can find several of these online and updated regularly, along with a survey of what economists, on average, are predicting.
The granddaddy of monthly economic indicators is the employment report from the Department of Labor.
This indicator is considered by many the best snapshot of the economy at that time and a good way to determine just what the Fed is going to do. That’s because it gives
a very good balance between company confidence in their businesses (economic growth expectations) and what they need to pay employees (wage inflation).
Federal Reserve Vice Chairman Stanley Fisher directly called the September 2016 employment report “pretty close” to a Goldilocks Number, so there’s no escaping the terminology.
What would it look like?
Let’s say economists were expecting an increase of 250,000 in nonfarm payrolls and for wage growth to rise slightly to 2.7% from 2.5%. If nonfarm payrolls rose by 270,000 and wage growth stayed steady, that’s in the Goldilocks zone. There is a stronger-than-expected labor market, but weaker than expected wage inflation. Wages are one of the main components of overall inflation that pushes rates higher.
Next may be a little more obscure to many people who don’t watch the market closely, but is well known to those who set the federal funds rate. Each month, the Bureau of Economic analysis release its report on Personal Income and Outlays and in that report is what’s known as the Fed’s favorite inflation gauge: the Personal Consumption Expenditures (PCE) price index, excluding food and energy.
That’s also known as core PCE price index or the core PCE price deflator.
How did it come to be a Fed favorite? Because “the PCE index covers a wide range of household spending,” according to the Fed itself. And we’re looking at core, as food and energy prices can skew the numbers sharply as they are more volatile.
The core PCE price index may not always have a consensus number, so it’s important to remember that the Fed is looking for inflation to rise at an annual rate of 2%. That’s considered a healthy increase in prices in a growing economy — a Goldilocks range.
Investors will also want to watch the more well-known inflation gauges, core consumer price index (CPI) and producer price index (PPI), against expectations and the 2% Fed target. That can be balanced with growth from the quarterly GDP report, although remember that’s backward-looking.
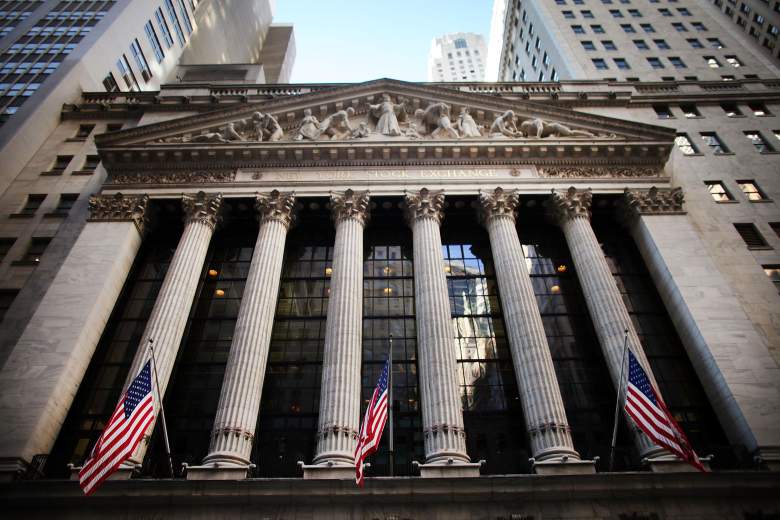
The New York Stock Exchange building.
(Getty)
How Your Mileage (Portfolio) May Vary
Unless you are investing in the broader market, such as with a position in the SPDR S&P 500 ETF (SPY), the question of whether the whole market goes up or down on a particular Goldilocks Number may not apply.
Of course you’ve heard all the financial advice that it’s essential to have a diversified portfolio across a multitude of sectors. But hey, we all have our preferences and biases and some sectors will be more weighted than others.
If you have a portfolio that’s heavily into bank stocks, you probably won’t be hoping for a Goldilocks visit. Financial services companies, which can loan out at higher rates, do well in a rising-rate landscape.
Conversely, if you are into low-risk utilities stocks, their high dividend yields won’t look too good as rates go up overall.
The CME Group did a lot of the heavy lifting with this explanation and chart of which stock sectors do better as rates go up and which do worse.
The advantage to this analysis is that the “by looking at the outperformance/underperformance of each sector versus the S&P 500 and correlating that with Fed Funds … (it) can instead focus on which subsectors of the equity market benefit from or are harmed by changes in rate expectations on a relative basis,” the CME wrote.
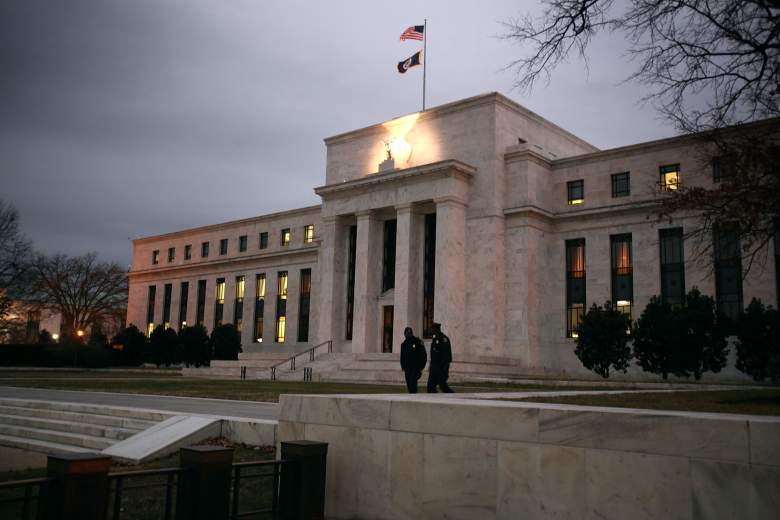
Flags fly over the Federal Reserve Building in Washington, D.C. (Getty)
What if the Fed Doesn’t Play Ball?
A Goldilocks Number, or Economy, may not be at all ideal for the overall market in some circumstances (like now), coming off a long streak of years of rates close to zero.
In recent jobs reports, the market was looking for both payroll and wage growth, since the economy has been below par for a while. Market participants can be willing to settle for higher rates from such a low bar if it shows the economy is really getting in gear.
Fortunately for individual investors, you can crowdsource how the market feels right after indicators come out. The CME fed funds futures can be used to calculate the possibility of a rate hike, according to traders.