Republican presidential nominee Donald Trump speaks at a rally at the Radisson Hotel August 25, 2016 in Manchester, New Hampshire.(Getty)
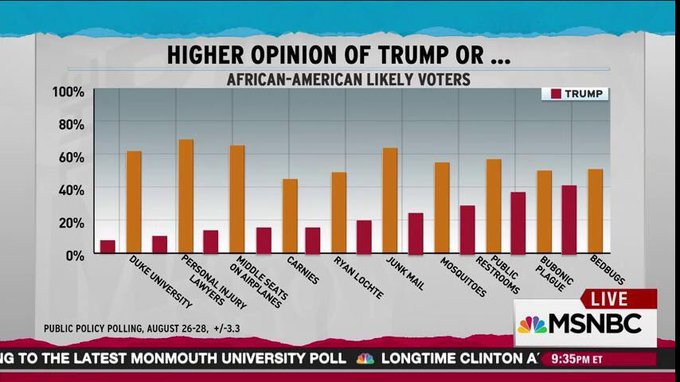
A new poll shows Donald Trump is viewed favorably by zero percent of black voters with some saying they think more highly of the bubonic plague and middle airplane seats.
That poll was conducted by PPP, a liberal-leaning polling firm, according to The Hill. The firm asked black voters “whether they preferred Trump to things such as bedbugs, junk mail, carnies, bubonic plague and middle airplane seats,” says The Hill. Black voters had a more favorable opinion of those things than they did of Trump, said MSNBC. They even liked Ryan Lochte and bedbugs better.
Things African Americans prefer to Trump, per @ppppolls: bedbugs, bubonic plague, mosquitoes, airplane middle seats.
However, that unique poll aside (it was shared by the Rachel Maddow show, and she’s clearly no fan of Trump), how does Trump fare with black voters? When studying recent general election polls listed on RealClear Politics, it becomes clear that, although Trump’s support with black voters isn’t zero in other recent polls, it’s in the single digits. In fact, despite his controversial platform on immigration, Trump fares even worse with black voters than he does with Hispanic voters in recent polls (although the latter still favor Hillary Clinton.) Simply put: Black voters prefer Hillary by a massive margin. And that’s contributing to a Clinton lead in recent polling averages. The RealClear Politics polling average had her up an average 6.1 percent in national polls from August 5 through August 28.
However, heading into September, the race started to tighten, with Trump and Clinton virtually tied in several polls.
This may be partly why Trump has been making a concerted push to earn the support of black voters lately – mostly by criticizing Hillary Clinton over such things as her friendship with the late Sen. Robert Byrd (a former KKK member) and her old comments on “super predators.” He’s also sounded confident that he’s earning the support of black voters, sparking criticism when he used the death of Dwyane Wade’s cousin, Nykea Aldridge, to insist blacks would vote for him. He wrote on Twitter, “Dwayne Wade’s cousin was just shot and killed walking her baby in Chicago. Just what I have been saying. African-Americans will VOTE TRUMP!” He’s also called Hillary a bigot. In turn, Clinton has tried to link Trump to the KKK and other white supremacists and insisted his campaign is based on prejudice.
Trump also recently went to services at a black church in Detroit, calling the African-American church the “conscience” of the country and pledging unity, said CNN. The polls below were taken before that outreach.
To the African-American community: The Democrats have failed you for fifty years, high crime, poor schools, no jobs. I will fix it, VOTE “T”
If Trump can earn even a few more percentage points of African-American voters, it could make a difference in a tight election, although state contests matter more in the end than national polls.
When it comes to black voters though, what does the data say? Here’s what recent general election polls say that include demographic information. Some polls are more specific than others in their public release of such demographic data, with some lumping all non-whites together into one category, and others breaking black voters out specifically.
Here’s how Trump fares with black and non-white voters in recent polls:
Monmouth University
The poll was released on August 29. It broke out the demographics of those polled and found that only 2 percent of those who have a favorable opinion of Trump (but not a favorable opinion of Clinton) are black.
Among those who have a favorable opinion of Clinton only: 58 percent are white, 24 percent are black, 12 percent are Hispanic, and 5 percent are Asian or other race.
Among those who have a favorable opinion of Trump only: 89 percent are white, 2 percent are black, 7 percent are Hispanic, and 2 percent are Asian or other race.
Among those who have an unfavorable opinion of Trump but no opinion of Clinton: 51 percent are white, 21 percent are black, 23 percent are Hispanic, and 6 percent are Asian or other race.
Among those who have an unfavorable opinion of Clinton but no opinion of Trump: 84 percent are white, 3 percent are black, 7 percent are Hispanic, and 7 percent are Asian or other race.
Among those who have an unfavorable opinion of both Trump and Clinton: 80 percent are white, 6 percent are black, 10 percent are Hispanic, and 4 percent are Asian or other race.
Voters were also asked: “Is your general impression of Donald Trump favorable or unfavorable, or do you have no opinion of him?”
The poll broke the race category down to “white non-Hispanic” and “Other.”
Fifty-four percent of white non-Hispanics viewed Trump unfavorably, 31 percent viewed him favorably, and 14 percent had no opinion.
Non-whites? Sixty-three percent viewed Trump unfavorably, 12 percent saw him favorably and 25 percent had no opinion. Clinton was viewed favorably by 50 percent of non-white voters and unfavorably by 61 percent of whites.
The Monmouth poll found Clinton ahead overall by 49 percent to Trump’s 42.
LA Times/USC poll
This poll has created charts tracking Trump’s support among different demographic groups, including black voters.
It shows that, in the most recent polling date of August 28, Clinton was earning the support of 84.8 percent of black voters, and Trump was earning 4.1 percent. His highest support with black voters came in mid-August when he earned the support of 14.6 percent, but those numbers then fell off.
That’s far worse than Trump’s support with Hispanics. Thirty-one percent of Hispanics are supporting Trump in the most recent polling, with 52.5 percent supporting Clinton. Trump does better with voters labeled “other ethnicity.” He’s ahead with that group 50.9 percent to 40 percent.
The poll found Clinton had 45 percent overall to 44 percent for Trump.
Quinnipiac University
This poll broke down demographics into two categories: white and non-white. Voters were asked, “Is your opinion of Donald Trump favorable, unfavorable or haven’t you heard enough about him? COMBINED WITH: (If Favorable/Unfavorable) Do you feel that way strongly or somewhat?”
Only 8 percent of non-white voters had a strongly favorable opinion of Trump, 5 percent had a somewhat favorable opinion, 5 percent had a somewhat unfavorable opinion, and 76 percent had a strongly unfavorable opinion. (5 percent hadn’t heard enough and 2 percent refused to answer.)
In contrast, only 43 percent of white voters had a strongly unfavorable opinion of Trump, although that was still the highest category. Twenty-seven percent had a strongly favorable view of Trump, 15 percent a somewhat favorable opinion, and 9 percent had a somewhat unfavorable opinion. (4 percent hadn’t heard enough and 2 percent refused to answer.
In contrast, Hillary was viewed strongly favorably by 44 percent of non-white voters and 18 percent of white voters. She was viewed somewhat favorably by 22 percent of non-white voters and 14 percent of white voters, and somewhat unfavorably by 6 percent of non-white voters and 7 percent of white voters.
However, 57 percent of white voters have a strongly unfavorable opinion of Clinton versus 20 percent of non-white voters.
Overall, Clinton led 51 to 41 percent in this poll. The poll was conducted from August 18 to 24.
Rasmussen Reports
This poll also shows Clinton with a lead, in this case 42 percent to 38 percent. The poll was conducted August 23 to 24.
The poll found, “Whites still prefer Trump, while Clinton has an enormous lead among blacks and a double-digit advantage among other minority voters.” The poll only provides a full demographic breakdown to subscribers.
Reuters/Ipso
This poll was conducted from August 20 to 24. It has Clinton leading overall 42 percent to 35 percent among likely voters.
Reuters has a chart that allows you to narrow results by demographics. People were asked, “If the 2016 presidential election were held today, would you vote for Donald Trump or Hillary Clinton?”
According to Reuters, of black voters polled from July 25 through August 25, 73.7 percent would choose Clinton, and 4.9 percent would choose Trump. Just over 10 percent wouldn’t vote, 6.1 percent refused to answer, and 5.3 percent would choose someone else.
Again, Trump does better with Hispanics than black voters. He would get 9.2 percent of Hispanic voters. He does best, but still poorly, with American Indian voters – 9.4 percent would choose Trump.
The Economist/You Gov
This poll was conducted from August 19 through August 23.
It showed that only 5 percent of blacks have a very favorable view of Trump. Nine percent have a somewhat favorable view of him. Seventy-two percent have a very unfavorable view of him. Seven percent have a somewhat unfavorable view, and 7 percent didn’t know. (In contrast, only 66 percent of Hispanics had a very unfavorable view of Trump).
In contrast, most black voters have a very favorable or somewhat favorable view of Hillary Clinton.
Eighty-four percent of blacks said they would vote for Clinton if the election were held today, and 8 percent of blacks would vote for Trump (in contrast, 28 percent of Hispanics would vote for Trump). White voters prefer Trump 46 percent to 34 percent (this poll included third-party candidates).