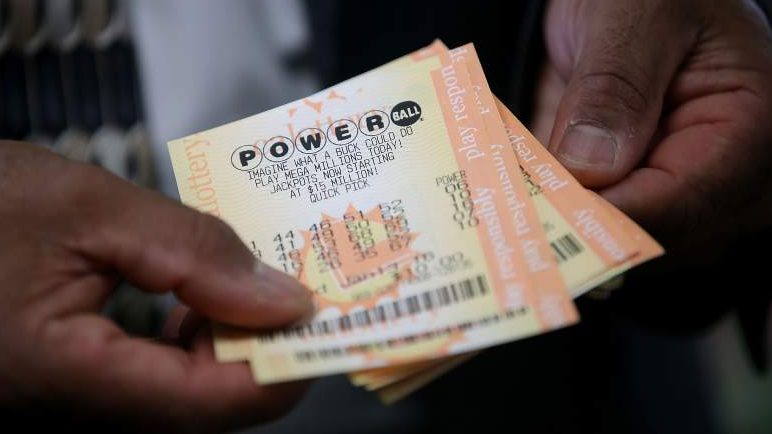
The Powerball jackpot is estimated to be $440 million for tonight, and if no one wins then it will grow even more. Although the numbers are drawn completely at random, some people still like to know the history of the winning numbers so they can base the numbers they choose on what’s won before. There’s no statistical reason to believe this will help you win, but sometimes this can be a fun strategy to use. Your odds of winning the Powerball jackpot are 1 in 292,201,338 per play.
To see a complete list of the numbers that have won in the past, there are a number of places you can go. Powerball has a list here but it’s not quite as easy to navigate as some other pages. Wisconsin has a better display of the winning numbers here. Here’s a look at the winning numbers that have been drawn since November 4 through early January, courtesy of the Wisconsin Lottery site. Stay tuned: if the jackpot continues to grow, we will provide an updated story on which numbers have been drawn the most.
| Wed, Jan 03, 2018 | 42 | 39 | 18 | 2 | 37 | 12 | 3X |
| Sat, Dec 30, 2017 | 58 | 28 | 51 | 41 | 36 | 24 | 2X |
| Wed, Dec 27, 2017 | 16 | 60 | 3 | 56 | 9 | 3 | 3X |
| Sat, Dec 23, 2017 | 44 | 15 | 1 | 13 | 3 | 25 | 2X |
| Wed, Dec 20, 2017 | 20 | 61 | 64 | 1 | 69 | 20 | 2X |
| Sat, Dec 16, 2017 | 35 | 63 | 37 | 9 | 50 | 11 | 2X |
| Wed, Dec 13, 2017 | 2 | 28 | 51 | 58 | 24 | 7 | 3X |
| Sat, Dec 09, 2017 | 36 | 60 | 55 | 37 | 25 | 6 | 5X |
| Wed, Dec 06, 2017 | 50 | 19 | 55 | 62 | 20 | 9 | 2X |
| Sat, Dec 02, 2017 | 32 | 30 | 36 | 28 | 58 | 6 | 3X |
| Wed, Nov 29, 2017 | 59 | 28 | 26 | 24 | 63 | 16 | 3X |
| Sat, Nov 25, 2017 | 53 | 8 | 54 | 27 | 13 | 4 | 2X |
| Wed, Nov 22, 2017 | 61 | 51 | 37 | 46 | 35 | 13 | 2X |
| Sat, Nov 18, 2017 | 17 | 31 | 28 | 32 | 39 | 26 | 3X |
| Wed, Nov 15, 2017 | 48 | 32 | 44 | 50 | 23 | 25 | 2X |
| Sat, Nov 11, 2017 | 56 | 6 | 4 | 30 | 16 | 18 | 2X |
| Wed, Nov 08, 2017 | 12 | 21 | 14 | 34 | 20 | 22 | 2X |
| Sat, Nov 04, 2017 | 51 | 48 | 12 | 26 | 14 | 13 | 3X |
Now, you may be looking for something more along the terms of which numbers are drawn most frequently. Powerball has a number frequency list, but it hasn’t been updated since September 30, 2015. However, LottoNumbers.com has been keeping up with the Powerball frequency since then, and updated its stats on January 5. According to them, the most common Powerball main draw numbers are (in order of drawn the most frequently to least): 26 (drawn 279 times), 16, 41, 32, 28, 22, 23, 42, 39, 19, 10, 9, 40, 20, 45, 35, 8, and 13 (drawn 258 times.)
The most common Powerball numbers, meanwhile, are: 6 (drawn 83 times), 20, 9, 11, 12, 2, 18, 10, 24, 26, 1, 17, 19, 29, 13, 15, 8, and 23 (drawn 69 times).
Interestingly, LottoNumbers.com reports that the least common Powerball numbers include 65 (drawn 12 times), 60, 67, 68, 66, 61, 62, 63, 69, 64, 56, 58, 57, 59, 55, 54, 53, and 51 (drawn 128 times).
According to their statistics, the most overdue Powerball numbers (excluding bonus balls) are: 5 (drawn 168 days ago), 40, 33, 11, 47, 7, 43, 52, 67, 68, 10, 65, 49, 45, and 29 (drawn 73 days ago).
LottoNumbers.com has a lot of other interesting statistics, if you feel like digging into them. They list the most common quadruplets, triplets, and pairs; the bell curve statistics; and the odds versus evens. The site also has a number generator, and includes statistics for many other lotteries too, including Mega Millions, California SuperLotto, Georgia Fantasy Five, Florida Lotto, Lotto Texas, Illinois Lotto, Indiana Hoosier Lotto, Lotto America, New Jersey Pick Six, New York Lotto, Ohio Classic Lotto, and more. It even includes statistics for European Lottos, like El Gordo, EuroJackpot, German Lotto, Irish Lotto, SuperEnalotto, UK 49s, UK Health Lottery, and more.
