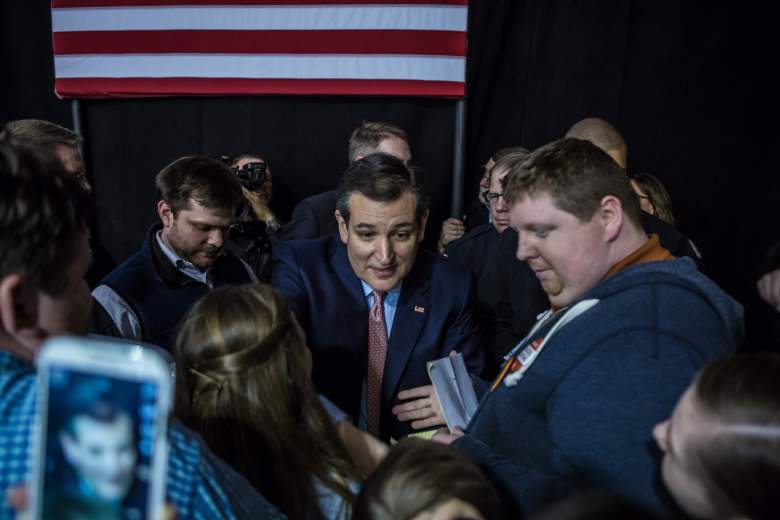
Ted Cruz trailed Donald Trump by 4 percentage points heading into the Iowa caucus, but ended up winning by 4 points instead. (Getty)
As voters head to the polls in Saturday’s South Carolina Republican primary, there’s been what seems like non-stop talk over the past week about polling data. As many as a half-dozen reputable firms have been polling the Palmetto State for 10 days, and multiple new polls have been released every day for the past week.
The talk, in many cases, can be useful. Individual polls can miss the mark substantially, but the average of polls at least provides a picture of what’s likely to happen.
Yet unlike general elections, which usually consist of only two candidates and tend to be pretty stable, primaries and caucuses can be a mess. With the first three nominating contests each separated by less than two weeks, the polling landscape changes quickly based on the media narrative from the previous state, candidates’ performances in debates, and occasionally, last-minute endorsements like the one Marco Rubio got Wednesday from South Carolina Governor Nikki Haley. The field in South Carolina has shifted substantially over the past several days, with Rubio gaining ground on Trump and even pulling within 3 percentage points in one poll.
Sometimes, despite the various factors involved, pollsters come pretty close to getting things right. That’s more or less what happened in New Hampshire, where Donald Trump was expected to finish close to 20 points ahead of his nearest competitor, and did just that. In Iowa, however, the polls were off by a wide enough margin to have incorrectly forecasted the winner.
We’ll take a look at what the polls got right and what they got wrong in Iowa and New Hampshire, but first, let’s take a look at the South Carolina landscape.
South Carolina Polling Averages
We’ll know later tonight how things have turned out in South Carolina. But here’s a look at the final RCP polling averages for each candidate. (Click here for a full breakdown of the South Carolina polling landscape.)
| CANDIDATE | VOTE% |
| Donald Trump | 31.8%% |
| Marco Rubio | 18.8% |
| Ted Cruz | 18.5% |
| Jeb Bush | 10.7% |
| John Kasich | 9% |
| Ben Carson | 6.8%% |
Iowa Polling Averages vs. Actual Results
In Iowa, the polls were off by a wide enough margin that they got the winner wrong, and substantially underestimated Rubio’s performance, which emerged as one of the biggest storylines of the caucus. Trump entered caucus day with a 4.7-percentage-point lead over Ted Cruz and an 11.7-point lead over Rubio in the RealClear Politics polling average. But Cruz and Rubio both out-performed their polling numbers, while Trump under-performed. The result was a win for Cruz and a closer-than-expected third place finish for Rubio, who finished just 1.2 percentage points behind Trump.
| CANDIDATE | POLLS | RESULT |
| Ted Cruz | 23.9% | 27.6% |
| Donald Trump | 28.6% | 24.3% |
| Marco Rubio | 16.9% | 23.1% |
| Ben Carson | 7.7% | 9.3% |
| Rand Paul | 4.1% | 4.5% |
| Jeb Bush | 4.1% | 2.8% |
| John Kasich | 2.9% | 1.9% |
| Carly Fiorina | 2.6% | 1.9% |
| Chris Christie | 2.4% | 1.8% |
| Mike Huckabee | 3.1% | 1.8% |
| Rick Santorum | 1.1% | 1.0% |
New Hampshire Polling Averages vs. Actual Results
Here’s a look at how the actual New Hampshire results compared to the final RealClear Politics polling average. The polls’ biggest miss was overstating the strength of Rubio, who was on the decline after a poor debate performance the previous week. The polls also slightly underestimated the strength of John Kasich. But the general picture that the polls painted – a commanding lead for Trump, with a logjam of candidates between second and fifth — proved to be accurate.
| CANDIDATE | POLLS | RESULT |
| Donald Trump | 31.2% | 35.3% |
| John Kasich | 13.5% | 15.8% |
| Ted Cruz | 11.8% | 11.7% |
| Jeb Bush | 11.5% | 11.0% |
| Marco Rubio | 14% | 10.6% |
| Chris Christie | 5.8% | 7.4% |
| Carly Fiorina | 4.8% | 4.1% |
| Ben Carson | 2.8% | 2.3% |
