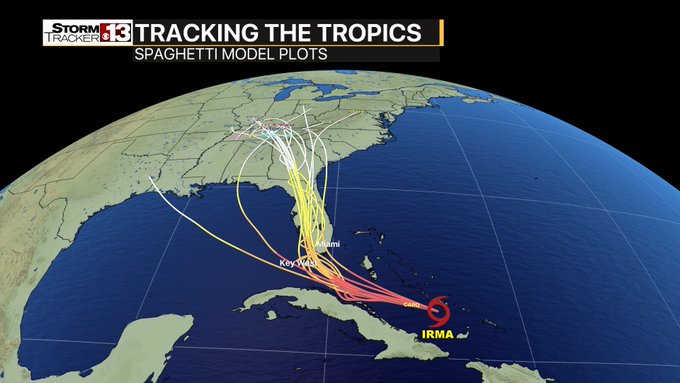
South Florida Waste Management District Where will Irma hit? See the latest Hurricane Irma spaghetti models on Saturday Sept. 9 that chart the storm's real-time path.
The latest Hurricane Irma spaghetti models on the morning of Saturday, September 9, as the storm gets closer to making landfall, showed it continuing to shift to the west, continuing a recent trend. That puts west Florida in far more peril than the previous day, although all of the forecasting models are projections subject to change due to the storm’s unpredictability.
For several days, the models had shown the storm tracking eastward, which raised hopes it could move out to sea and raised concerns it could end up making landfall in South Carolina or along Florida’s eastern coast. Then, on Friday morning, the spaghetti models revealed a possible westward shift in the storm.
The newest run of the spaghetti models shows lots of agreement but have shifted to the west again, taking #Irma over western Florida coast.


However, the Saturday spaghetti models are showing that this westward shift is becoming more pronounced, imperiling the western coast of Florida. Cyclocane has a constantly updating spaghetti model. On the morning of September 8, it also showed western Florida cities like Tampa and Naples in greatest peril. Some spaghetti models have even shown the hurricane could extend into Alabama.
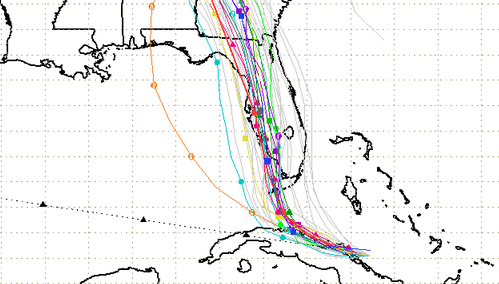
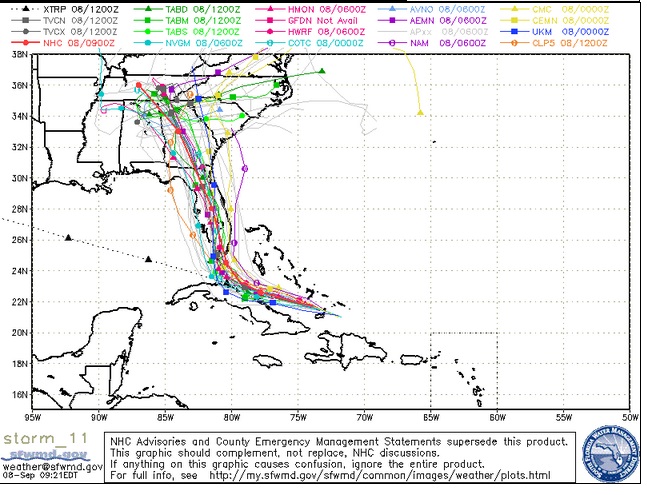
The South Florida Waste Management District has been running updated spaghetti models of Irma for days. Here, you can see a sequence of the models, most recent to older, to see how the storm has shifted.
Saturday morning:
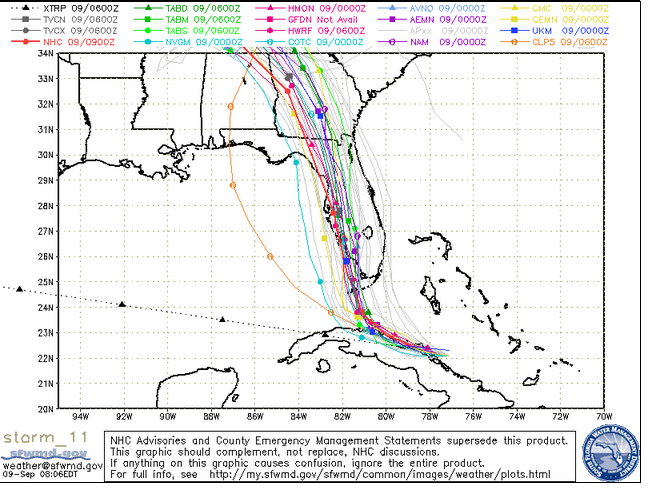
South Florida Waste Management DistrictSaturday morning spaghetti model.
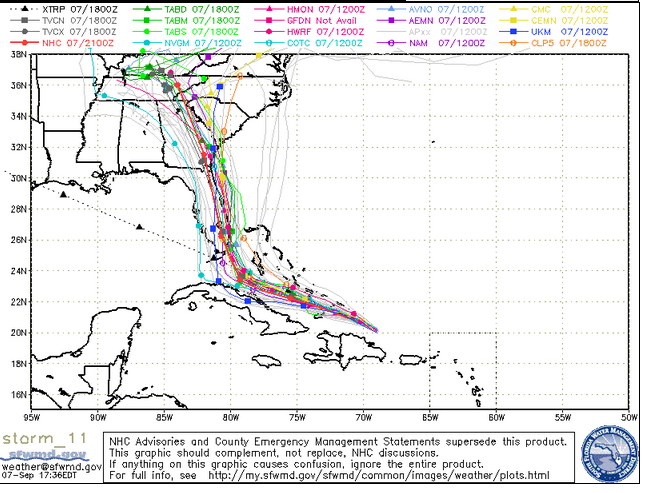
Friday evening:
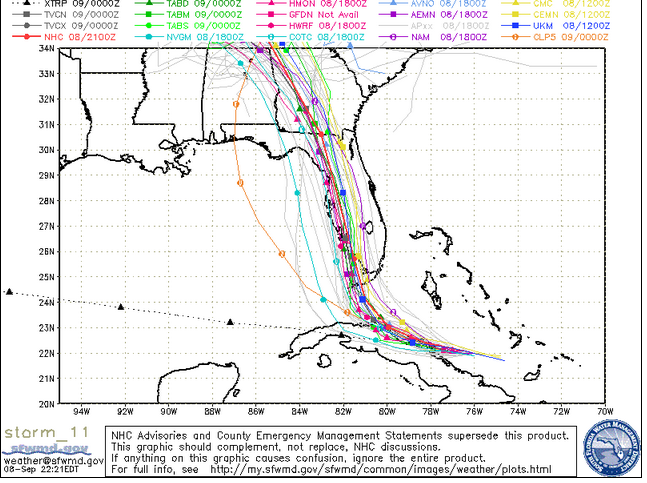
Friday evening spaghetti model.
The Sun Sentinel noted this trend, writing, “Hurricane Irma regained Category 5 strength late Friday night and shifted its likely course farther west, away from the heavily populated southeast Florida coast…The shift in course could be good news for Broward, Miami-Dade and Palm Beach counties and bad news for Naples, Fort Myers and Tampa.”
However, that doesn’t mean that people in the rest of Florida or states like South Carolina should breathe a sigh of relief yet; the storm is unpredictable, and all of South Florida, in particular, is in peril. An error of just 50 miles could be very bad for the east coast of Florida, the newspaper pointed out.
This was the model on Friday morning:
South Florida Waste Management DistrictFriday morning September 8 spaghetti model.
Thursday night:
South Florida Waste Management DistrictThursday evening spaghetti model for Hurricane Irma.
Wednesday night:
South Florida Waste Management DistrictA spaghetti model of the Hurricane Irma path for September 6 in the evening.
The National Center for Atmospheric Research is also running constantly updating spaghetti models. You can see some of their September 9 spaghetti plots here and here.
The National Oceanic and Atmospheric Administration (NOAA) uses a different cone model. Here is what it showed on the morning of September 9 for comparison purposes:
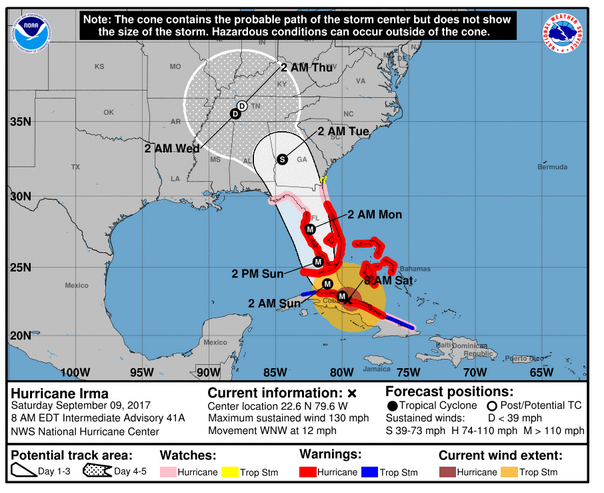
NHCSaturday morning forecast cone.
Here is an arrival time path maps from NOAA:
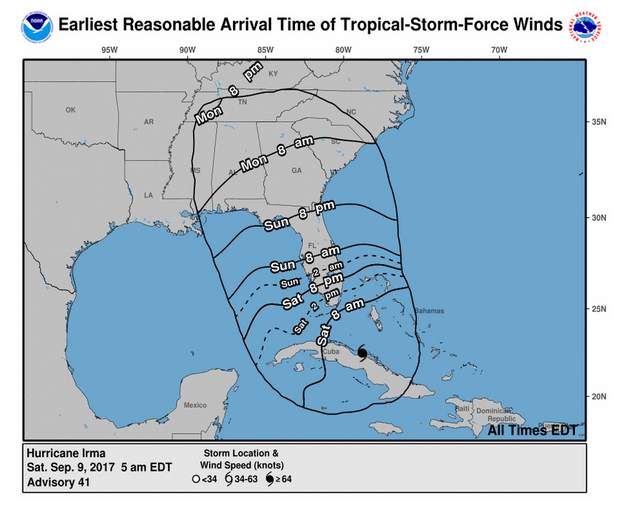
NHCWind arrival times for Irma – Saturday, September 9 projection.
The European model, which many think is the most accurate one, is also showing the western trend.
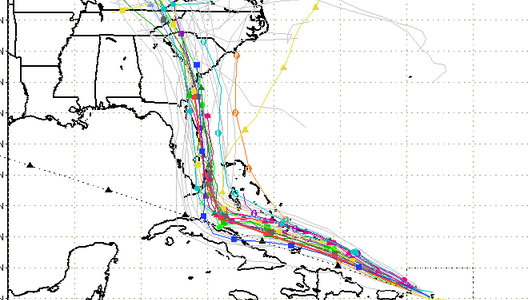
Here are some other recent spaghetti models:
The models are locked in to a track for #Irma. Very tightly clustered on the west coast of FL and into GA. Remember, impacts FAR from center
Spaghetti plots for #Irma as of Fri afternoon …. West side of FL is the area where models converge the most….