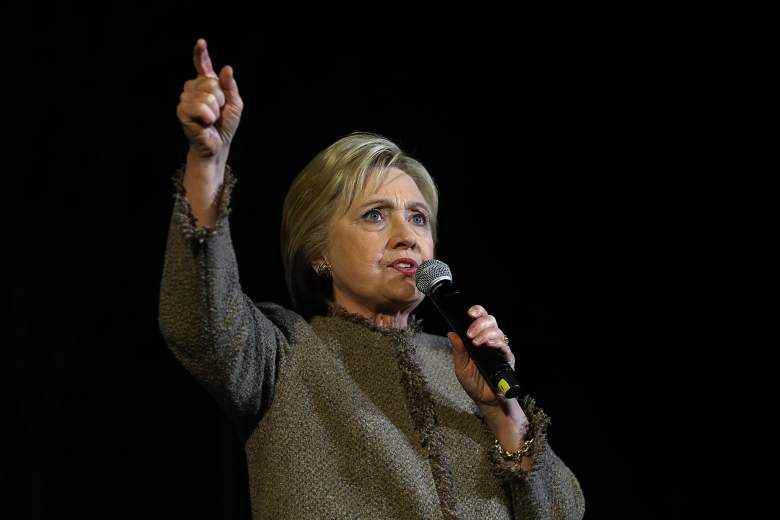
Hillary Clinton, here at a campaign event in South Carolina, is running away with the state’s polls. (Getty)
After a close Iowa win for Hillary Clinton and runaway victories for Bernie Sanders and Clinton in New Hampshire and Nevada, the pledged delegate count is tied before Saturday’s contest in South Carolina. The polls in South Carolina, according to RealClearPolitics, have greatly and consistently favored Clinton, as have the FiveThirtyEight forecasts.
While polls are too wide-ranging to track individual day-to-day movements, leaving some hope for Sanders, Clinton’s wide margins should have her feeling pretty comfortable.
| Pledged Delegate Count | 2,383 Needed to Win |
| Hillary Clinton | 51 |
| Bernie Sanders | 51 |
Here’s a look at the state of the South Carolina polls:
South Carolina Polling Averages
Polling aggregator RealClearPolitics takes the latest scientific polls and compiles them into an average of what all the pollsters are seeing. While it does allow for an outlier poll to potentially skew the average, it provides a good overall picture. On primary day, the polls look very favorable to Hillary:
| RealClearPolitics Averages | |
| Hillary Clinton | 58.3% |
| Bernie Sanders | 31.7% |
Iowa Polling Averages vs. Actual Results
As was mentioned before, polls are often an inexact science. Polls from Iowa both overestimated Clinton’s lead and underestimated the Clinton and Sanders vote totals:
| Candidate | RCP Average | Final Result |
| Hillary Clinton | 47.9% | 49.9% |
| Bernie Sanders | 43.9% | 49.6% |
A lot of this mixup had to do with a wrinkle in Iowa’s Democratic caucus procedure, which states that a candidate who fails to get 15% of the caucus-goers’ support at a precinct is declared non-viable and has his or her supporters sent to other candidates or to uncommitted status. Martin O’Malley, who polled at 4.3 percent in the RealClearPolitics polling averages, had most of his support sent to the Clinton or Sanders camps in hard-to-predict numbers. This rule appears in no other contest, and other state polls have been, and are expected to be, closer to the final result.
New Hampshire Polling Averages vs. Actual Results
The next state up, New Hampshire, had no such confounder nor the presence of another candidate to dilute the results, but polls there were still off regarding the final result:
| Candidate | RCP Average | Final Result |
| Bernie Sanders | 54.5% | 60.4% |
| Hillary Clinton | 41.2% | 38% |
The result allowed Sanders to pull briefly in front in the pledged delegate count.
Nevada Polling Averages vs. Actual Results
Nevada, despite having a reputation as hard to poll, ended up having as close a match between final polling averages and election night results as the other states:
| Candidate | RCP Average | Final Result |
| Hillary Clinton | 48.7% | 52.7% |
| Bernie Sanders | 46.3% | 47.2% |
The difference between the final polling average and the eventual vote spread was just 3.1 percent, versus 9.1 percent in New Hampshire and 3.1 percent in Iowa.
South Carolina GOP Polling Averages vs. Actual Results
While we don’t yet know how well the Democratic polls will match the South Carolina results, we do have final results from the Republican race conducted February 20. The results in that race match up fairly well with the polls:
| Candidate | RCP Average | Final Result |
| Donald Trump | 31.8% | 32.5% |
| Marco Rubio | 18.8% | 22.5% |
| Ted Cruz | 18.5% | 22.3% |
| Jeb Bush | 10.7% | 7.8% |
| John Kasich | 9% | 7.6% |
| Ben Carson | 6.8% | 7.2% |
There’s just 3 points separating Donald Trump’s aggregated polling lead from his voting lead, .1 points tighter than the Democratic results in Iowa and Nevada. While that didn’t make a difference in the race in South Carolina, where all GOP delegates are awarded to the winner, it represents roughly half of one of South Carolina’s delegates, meaning that if the polls are similarly accurate for the Democrats as for the Republicans in South Carolina, Bernie Sanders is within striking distance of one more pledged delegate.

