Donald Trump. (Getty)
The presidential polls (largely) got it wrong. They (and many of the forecasting sites based on them) predicted that Hillary Clinton would be the next president.
Instead, Donald Trump swept to a commanding victory. How could the polls have missed the Trump groundswell of support, especially in key blue battleground states? First of all, not all of them were wrong. Trafalgar Group, a Republican pollster out of Atlanta, the Los Angeles Times/USC poll, and the IBD/TIPP poll did well.
However, a slew of polls were wrong. Sites that predict elections using differing statistical models (often reliant on polls) also got the election wrong. A new model called Votecastr, that was supposed to offer real-time predictions, got every single state it analyzed wrong except one that went for Clinton. However, the professors did better. Political scientists who don’t just use polling data in their predictions but considered such factors as economics and the president’s approval rating did a better job predicting that Trump could win as a group (although some also got it wrong).
Why did the polls get it wrong? Here are the prevailing theories, although no one is certain, and it will take time to analyze:
Turnout & Enthusiasm

Supporters of Republican presidential nominee Donald Trump are decked out in campaign signs before the rally in Michigan. His supporters often come dressed up for his rallies, wearing Trump accessories. (Getty)
The polls did not properly perceive shifts in turnout – the enthusiasm factor – meaning who was actually going to get off their sofas to go out and vote. In the three rust-belt states that Trump won, the margins were small, and Clinton did not turn out her base in urban areas. However, the polls also did not perceive that western areas of the rust-belt states that went for Obama would flip to Trump.
The pollsters didn’t grasp the fact that there was more enthusiasm on the Trump side among voters, some argue.
In Wisconsin, which the pollsters mostly got wildly wrong, there was also a new factor introduced that could have depressed turnout: It was the first election in which Wisconsin voters needed to present a photo ID.
FiveThirtyEight said early voting surged but election day voting dropped leading to overall turnout drops, especially in states Clinton lost. The overall number of voters was up but only 57% percent of eligible voters cast ballots, down from 2012, said the site, adding that turnout was up compared to past presidential elections through 2012. However, showing the limitations on turnout being the driving force for the bad polling: In the states Trump won, the turnout did not drop, FiveThirtyEight said.
One pollster said Republicans turned out at the same rate on election day as Democrats, but they have a registration disadvantage, showing greater enthusiasm.
‘Shy’ Trump Voters
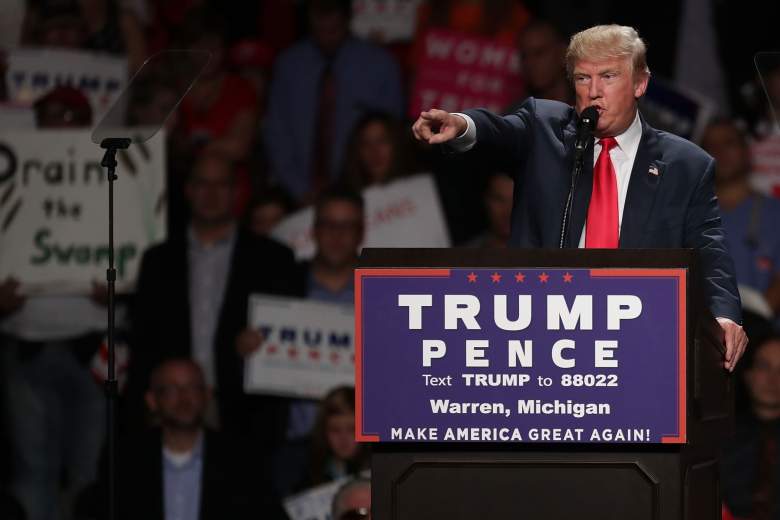
Donald Trump speaks to supporters in Warren, Michigan. (Getty)
Before the election, Trump claimed that some of his voters were too “shy” to admit publicly that they were voting for him. Maybe he was right. It’s not really shyness though; the phenomenon is known as “social desirability bias.” People fear it’s not socially acceptable to say they support Trump, so they lie or don’t talk to pollsters. Just look at the reaction after Trump won, with people labeling Trump voters as racist or sexist. No one wants to be called those things.
A study before the election found that there were such shy Trump voters (affluent, college-educated mostly), but opined that there weren’t enough of them to sway things. Of course, it was Trump’s flipping of formerly Democratic areas that were not dominated by affluent or college-educated people that gave him the White House. Others argue that women were most reluctant to admit they were voting for Trump.
Pollster Frank Luntz argues that Trump voters refused to participate in polls because they thought the process was rigged.
Not Reaching the Right Voters
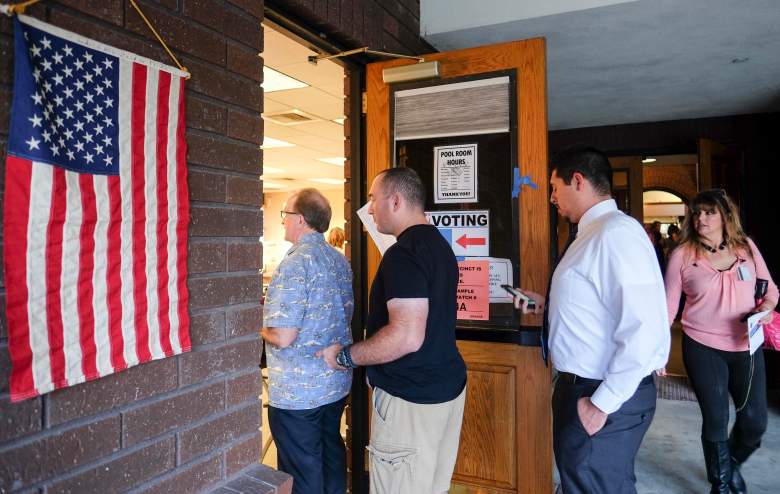
Voters line up to cast ballots on election day. (Getty)
FiveThirtyEight points out that if some groups of voters are hard to reach, polls will replicate each other’s mistakes.
The polls fared worse in states with more non-college educated whites, said FiveThirtyEight.
Politico quoted one pollster who says polls “had under-sampled non-college-educated whites, a group that Trump appealed to,” relying on the belief that the nation’s changing demographics would dictate the election.
The Atlantic says the problem might be cell phones in part. “Cell phones are not usually publicly-listed, making it harder and harder to find representative samples,” the site notes. Polls that weight likely voters based on past elections like 2012 missed the shift among some Obama voters to Trump, the Atlantic said.
The Comey Letter
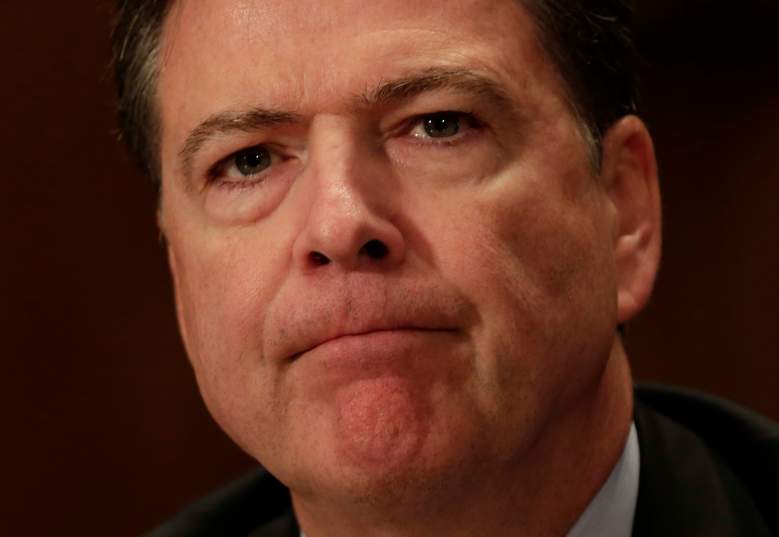
FBI Director James Comey. (Getty)
Polling averages extend back in time, and some states didn’t have many recent polls conducted after James Comey’s first letter to Congress that the FBI would investigate new emails to see if they were significant to the agency’s earlier investigation into Clinton’s emails. They weren’t, he later said.
Trump prevailed in states without robust early voting, such as Pennsylvania and Michigan, which could indicate a last-minute switch in opinions due to the letter.
The Close Margin

Supporters look on as Hillary Clinton speaks during a campaign rally at C.B. Smith Park on November 5, 2016 in Pembroke Pines, Florida. With three days to go until election day, Hillary Clinton is campaigning in Florida and Pennsylvania. (Getty)
Trump’s victory was wide, but it wasn’t deep. He picked up Wisconsin, Michigan (arguably) and Pennsylvania, shocking pundits. However, he won three rustbelt states (although the AP still hasn’t called Michigan) by only a combined total of 112,000 votes.
There Are Fewer Polls Overall

The crowd in Eau Claire, Wisconsin was quite enthusiastic, with lines about Hillary Clinton being corrupt and about the media being dishonest receiving a particularly positive response. A fair number of people in the audience seemed to have come from Minnesota; when Trump asked how many fans were from Minnesota, the applause was surprisingly loud. (Getty)
Fewer polls means a greater chance of polling error, and there were simply fewer polls in 2016 than there were in 2012. Some battleground states had very few or not very reliable polls.
For example, shortly before the election, Minnesota had not had a non online poll since October 22, which was before James Comey’s letters to Congress as well as big Obamacare increases that hit some battleground states.
On November 2, Vox bemoaned the decrease in the number of polls, writing, “In the 2016 cycle this has been especially noticeable in a clutch of states that are somewhat bluer than the national average, notably Colorado and Wisconsin, plus, to a lesser extent, the other states of the Great Lakes. Since these states voted for Obama twice and since Clinton has led in almost every national poll, it’s easy to kind of mentally write them down in the Democratic column. But in a close national race, these should be competitive states, and you would want to see actual data. But we haven’t had much.” Bingo!
News organizations with declining resources may conduct fewer polls. The cost of polling has risen as more people screen calls for telemarketers, forcing pollsters to call a larger number of people to get their samples. More sites started aggregating other people’s polls instead of conducting polls themselves, said Vox.
FiveThirtyEight says the state polls were more unreliable than the national ones.
Not all polls and predictions were as wrong as others, though.
Here’s a breakdown:
Academic Models
Vox
At 4 a.m. on election day, Vox predicted that a generic Republican candidate would win the race, but then decided that Trump was too different of a Republican to win, something the site called a “Trump Tax.” The differential was based on what was seen in the polls.
In other words, Vox’ model got it right, but Vox didn’t go with what its own numbers were saying.
Vox noted, “Vox’s model, developed by Washington University in St. Louis’s Jacob Montgomery and Texas A&M’s Florian Hollenbech, is a weighted average of six academic forecasting models. Three of those models have Trump ahead, and three have Clinton, but the one with the best past track record, (Alan) Abramowitz’s, predicts a Trump win.”
Thus, some of the academic forecasting models did a better job of predicting a Trump victory than polling alone did.
Alan Abramowitz
He was right overall but also wrong. Abramowitz, a political science professor at Emory University, saw Trump’s strength when others didn’t, but his model studies the popular vote, and he predicted Trump would win the popular vote. Clinton ended up winning the popular vote, while Trump won the electoral college.
He wrote in August, “The Time for Change forecasting model has correctly predicted the winner of the national popular vote in every presidential election since 1988. This model is based on three predictors — the incumbent president’s approval rating at midyear (late June or early July) in the Gallup Poll, the growth rate of real GDP in the second quarter of the election year, and whether the incumbent president’s party has held the White House for one term or more than one term.”
Still, the professor predicted the victor right.
He concluded, “The Time for Change Model predicts a narrow victory for Donald Trump — 51.4% of the major party vote to 48.6%.” He then opined, though, that Clinton would probably win anyway because Trump was such a non-traditional candidate that he would lose Republican support.
Primary Model
Primary Model.com predicted the election right. Helmut Norpoth, a Stonybrook University political science professor, wrote before the election, “It is 87% to 99% certain that Donald Trump will win the presidential election on November 8, 2016; 87% if running against Hillary Clinton, 99% if against Bernie Sanders.” The model looks at primary polling but also the election cycle.
Norpoth wrote, “What favors the GOP in 2016 as well, no matter if Trump is the nominee or any other Republican, is the cycle of presidential elections. After two terms of Democrat Barack Obama in the White House the electoral pendulum is poised to swing to the GOP this year. ”
Norpoth added, “In a match-up between the Republican primary winner and each of the Democratic contenders, Donald Trump is predicted to defeat Hillary Clinton by 52.5% to 47.5% of the two-party vote. He would defeat Bernie Sanders by 57.7% to 42.3%.”
Professor Ray C. Fair
His forecasting is pretty hard to interpret for a person not familiar with macroeconomics, but he predicted Clinton would get 44% of the final vote, with a Trump victory. You can read how he got there here. Fair is an economics professor at Yale University. His predictions are based on macroeconomic modeling.
Polling Averages
RealClearPolitics
RealClearPolitics’ final polling averages got five states basically right, predicted a different winner in four, and got the right winner in five others but with the margins way off. Some observations: The polling averages got all three traditionally blue rust-belt states that Trump won wrong, predicting Clinton would win them. They also underestimated Trump’s degree of support in some states where he was ahead (like Iowa and Ohio). The site’s founders are conservative in philosophy but have said they are trying to create a site for all ideologies.
Interestingly, the polling averages underestimated Clinton’s degree of support in two states with large Hispanic turnout: New Mexico and Nevada. In three of the four polling averages where the call was completely blown, the final averages did have the race in the margin of error. Thus, if you had read the RCP tea leaves the morning of the election, it was clear that Trump still had a chance. However, since his support was underestimated across the board, it appeared he would have to run the table and win almost everything up for grabs to have a chance, with the rust-belt states appearing tantalizingly out of reach.
The final polling averages are first in the list below with the actual victor and margin of victory second:
Nailed it
New Hampshire 0.6% Clinton (0.2% Clinton)
Virginia 5% Clinton (4.9% Clinton)
Colorado 2.9% Clinton (2.1% Clinton)
Arizona 4% Trump (4.3% Trump)
Florida 1.3% Trump (0.2% Trump)
Blew it
Pennsylvania 1.9% Clinton (1.2% Trump)
Michigan 3.4% Clinton (0.3% Trump)
Nevada 0.8% Trump (2.4% Clinton)
Wisconsin 6.5% Clinton (1% Trump)
Got it Right but the Margins Were Off
Ohio 3.5% Trump (8.6% Trump)
North Carolina 1% Trump (3.8% Trump)
Iowa 3% Trump (9.6% Trump)
Maine 4.5% Clinton (Clinton 2.7%)
New Mexico 5% Clinton (8.3% Clinton)
Huffington Post
The Huffington Post is a liberal-leaning site. It chose not to include the Los Angeles Times/USC Dornsife poll in its polling averages all year, even though, in the end, that poll was the only one that consistently predicted a Trump victory. It was derided for seeming to overstate Trump’s support. The poll is different from others because it followed the same group of people from the start of the election to the end.
The Huffington Post’s forecast model had predicted there was a 98% chance Clinton would win. In a post mortem, the site wrote, “Florida, North Carolina, Pennsylvania, Wisconsin and Michigan all were wrong in our model.” The model relied on polls and the site now cautions that polls can be filled with errors.
The site’s polling average predicted Clinton would win 47.3% to 42%.
VoteCastr
VoteCastr was a new model that attempted to predict the election using real-time projections. It got everything wrong, except Nevada, predicting Clinton victories in the seven states it followed. The site combined turnout and early voting data to come to its conclusions.
Election Forecasting Models
PredictWise
PredictWise gave Clinton almost a 90% chance of winning the election.
PredictWise says it “reflects David Rothschild’s academic, peer-reviewed, research into prediction markets, along with polling and online/social media data.”
The New York Times’ UpShot
The New York Times’ UpShot site gave Clinton an 85% chance of winning the election.
The model relied on national and state polling and said, “Mrs. Clinton’s chance of losing is about the same as the probability that an N.F.L. kicker misses a 37-yard field goal.”
The site called Ohio and Iowa right but completely flubbed the rust-belt states; for example, it gave Trump only an 11% chance of winning Pennsylvania.
FiveThirtyEight
FiveThirtyEight is run by the respected statistician Nate Silver. The site gave Trump only a 29% chance of winning the electoral college at the end. However, that was higher than other forecasting sites.
The site factors in historical accuracy of polls.
The Polls That Got it Right
USC/LA Times
The Los Angeles Times notes that this poll was constantly the outlier that showed Trump winning.
The poll, in the end, showed Trump winning by 3% and was generally about 6% higher than most polls all along. The poll was attacked for its complex system that weighted its sample of voters. The New York Times wrote a detailed article that questioned the poll’s approach; it focuses on panelists who are repeatedly reinterviewed, rather than drawing from new samples.
Trafalgar Group
This is a Republican leaning poll that suspected people were lying to pollsters that they supported Trump. So the pollsters started also asking people who they thought their neighbors would vote for and determined the numbers were different.
The firm, which is based out of Atlanta, adjusted its numbers to account for this factor and predicted that Trump would win Pennsylvania and Michigan as well as the electoral college, says TIPP Online.
The poll did get some other states wrong.
IBD/TIPP
Of the 10 most recent polls in the Huffington Post database, this one came closest. It predicted right before the election that Clinton was up by 1, the closest in national polls.
Republicans were considerably more interested this time than four years ago, the pollster said. The poll queries respondents about their enthusiasm, and then factors this into the results.
The poll had Trump up 1.6% in a four-way race on election day. Investors Business Daily noted, “Not one other national poll had Trump winning in four-way polls. In fact, they all had Clinton winning by 3 or more points.”
State Polls That Got it Right
Using the RealClearPolitics polling database, here are polls that got it right in the days right before the election. The Emerson and Gravis polls had a pretty good track record also in some states:
Florida: Remington Research and Trafalgar Group had Trump winning Florida, but their margins were overstated.
Ohio: All of the recent polls predicted a Trump victory, but none hit the margin right.
Pennsylania: Trafalgar Group nailed the Trump Pennsylvania victory (saying he would win by 1; he won by 1.2%). Harper had the race a tie.
Michigan: Trafalgar was the only pollster predicting a Michigan win, although it overstated his margin.
New Hampshire: Clinton won by 0.2%. Emerson said she would win by 1. Boston Globe/Suffolk and UMass Lowell/7 News predicted a tie.
North Carolina: Trafalgar Group and WRAL-TV/Survey USA predicted Trump’s victory but overstated it.
Nevada: Gravis pretty much nailed Nevada.
Wisconsin: No one had Wisconsin right.
Iowa: The Des Moines Register was closest, but even pollsters who correctly predicted Trump would win Iowa tended to underestimate the degree of support for him.
Virginia: Lots of pollsters got Virginia right. The closest: PPP, Christopher Newport University, and Gravis.
Maine: Emerson was closest, but every poll overestimated Clinton’s support in Maine.
Colorado: Most pollsters predicted Clinton would win Colorado. Emerson was closest.
Arizona: Pollsters correctly predicted Arizona. Emerson was closest.
New Mexico: Pollsters predicted Clinton would win New Mexico, but most understated her support. Gravis hit it almost dead on.
